A real-world case study on optimizing the branch network and reinvesting in banking’s biggest growth opportunity
It is well understood that COVID is presenting what PwC calls “the most serious challenge to financial institutions in nearly a century.” With effects rippling across the worldwide economy, the impact on banking is particularly acute as entire transaction and delivery systems shift to adapt to new consumer realities. While so much is still unknown about the long-term implications of the global pandemic, one thing is abundantly clear: branch banking will need to change to survive. With challenges that were already present before COVID, developing a holistic strategy for the branch banking channel is now non-negotiable.
In their recent Future Branches presentation, Sean Keathley and Gina Bleedorn addressed how to develop a branch optimization plan based on powerful data-driven insights and growth opportunities in key expansion markets. Addressing the branch channel is critically important now as banking grapples with very real demands on its physical distribution network due to COVID. In this presentation, several real-world examples were integrated into a step-by-step roadmap for optimizing a typical community bank branch service area, including a mixture of interconnected urban and suburban locations.
Defining Opportunity
As Adrenaline’s leaders stated in the Future Branches presentation: You can’t close your way to profitability. Rather, branch network optimization is about balancing a complex set of factors designed to mitigate risk while maximizing opportunities. Decision-makers must focus on: identifying closures with the least-risk; reducing branch operating expenses; retaining and growing earnings by reinvesting savings into remaining branches; right-size staffing which includes implementing cash automation and universal banking; and allocating spend and prioritization aligned with market opportunity.
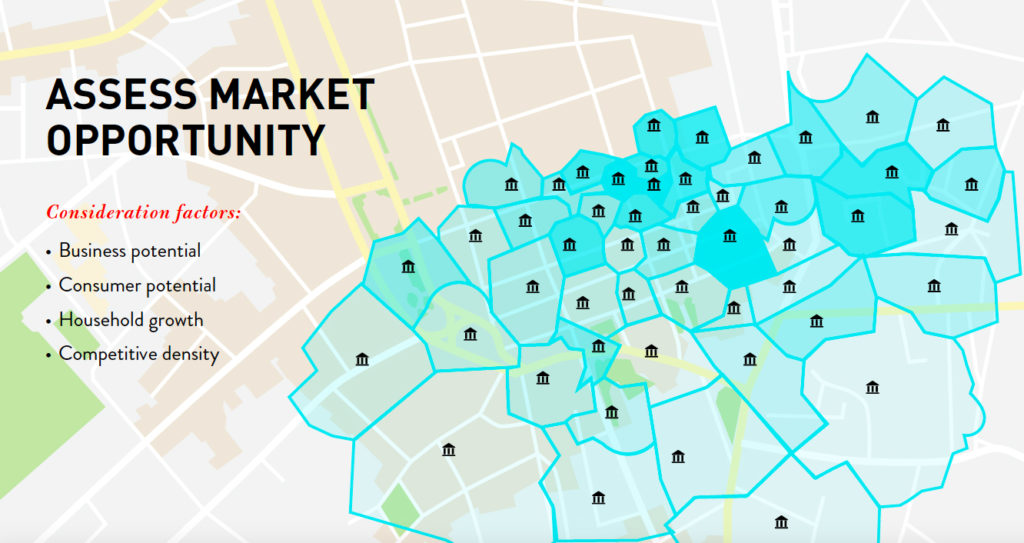
Market presence is defined by a distinct dominant market area and surrounding submarkets, with market size largely determined by the density of the population and the service needs within it. Typically, the more concentrated a market area, the more opportunity exists. Within each market, banks recognize their future prospects by identifying what they want to capture of available economic growth, household growth, consumer demographics and/or business banking opportunities. While a bank may be present in one of these growth markets, if their branches are not optimized, they won’t be getting their fair share of business there. That’s why maximizing branch performance is so critical.
Contemplating Closures
It’s an unfortunate fact-of-life for banks that not all branches can or should remain open. Some branches may be in a community that no longer needs them or is no longer performing well within the market, despite its potential. In optimizing any branch network, banks will need to evaluate potential closures with a keen eye toward lowest market opportunity and lowest branch performance, because branches that are not performing well often sit in markets with waning potential. In considering closure, banks must also identify a close-by receiver branch. In fact, the number one risk factor in closing any branch is distance to surviving branch.
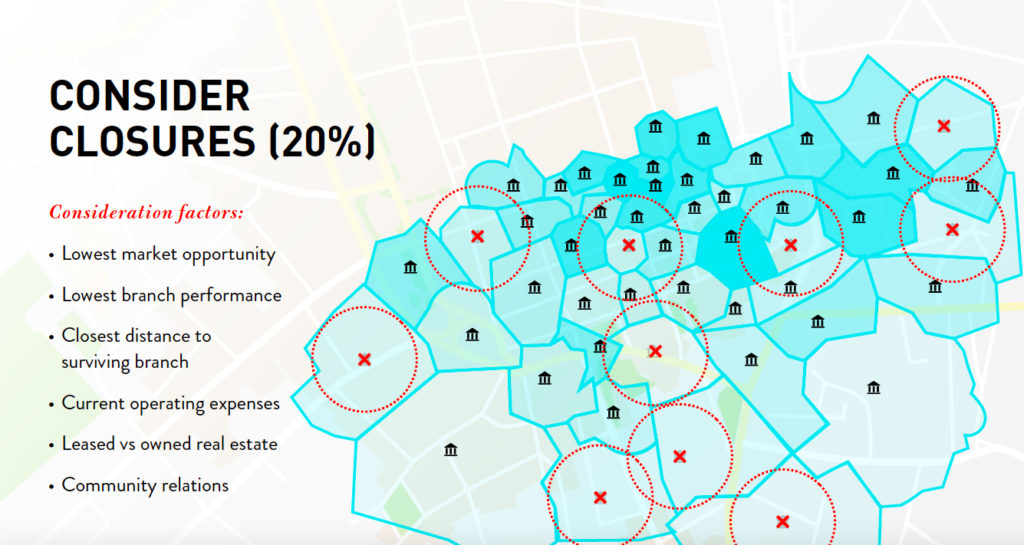
Other considerations in closure include operating expenses and the real estate situation of the current branch. Factors like whether the bank owns the building or is leasing and how long the remaining lease on the building is will determine how complex it will be to close the branch from a practical and operational standpoint. Community relationships are also a major consideration in closure. What kind of impact does closing the branch have on the bank’s standing within the community? Within a contiguous market, for example, poor community relations in one submarket can contaminate relationships in other branches still open within the larger market.
By the Numbers
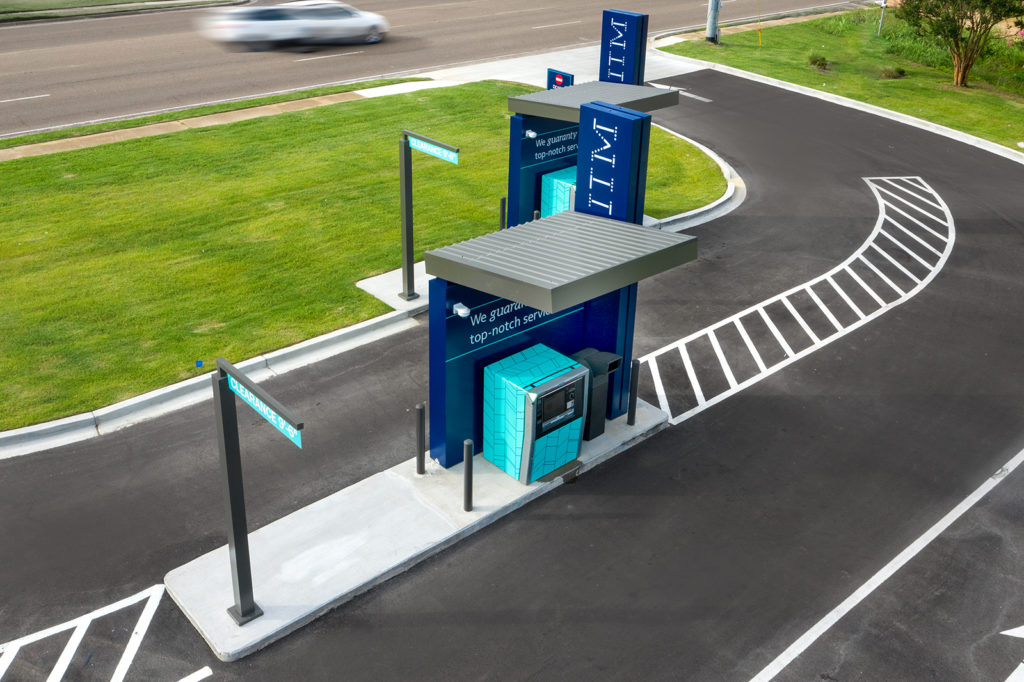
In the case study, data and analytics were used to evaluate the branch network, finding that 20% – 10 of the 50 branches – were identified as candidates for closure. In this example, the branches in the middle of the network had many surrounding branches close-by that could receive customers from closing branches, but in other markets to the south and the west, there were far fewer receiver branches. In areas where banks will have the furthest distance to surviving branches, consider a remediation strategy like a drive-up ITM – a brand beacon which does more than a standard ATM and is remotely staffed with a trained employee for enhanced services.
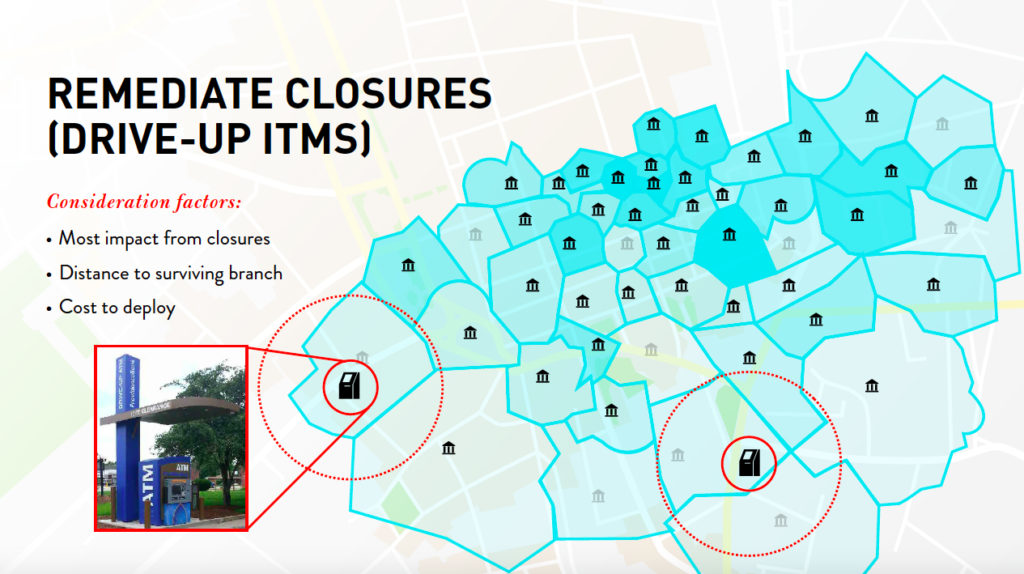
Instead of $850,000 or $500,000 of NIE – non-interest expense, which is the measure of operating costs annually – an ITM might be only $30,000 of NIE. With an initial cost to deploy at $100,000 to $150,000 and ongoing maintenance and expenses quite low, an ITM would represent a fraction of the cost of operating a fully staffed branch. Yet, an ITM represents a presence in the market as a physical point-of-contact that enables transactions while still allowing customers to talk to a banker on-screen, ultimately delivering a more humanized experience with a vital layer of personalization.
Hub-and-Spoke
Optimizing branch networks leans heavily on operational efficiency, and one of the most efficient strategies for branch networks is deploying hub-and-spoke cluster models – a powerful way to deliver staffing efficiency and prioritize change. For staffing efficiency within hub-and-spoke, cash automation allows banks to ramp up transaction speed and accuracy and decrease operational costs at the same time, reducing staffing needs by about one and a half tellers per branch. At this time, only about 40% of all banks in the country have cash automation inside the branch, so there is still a rich opportunity to capture savings and build speed.
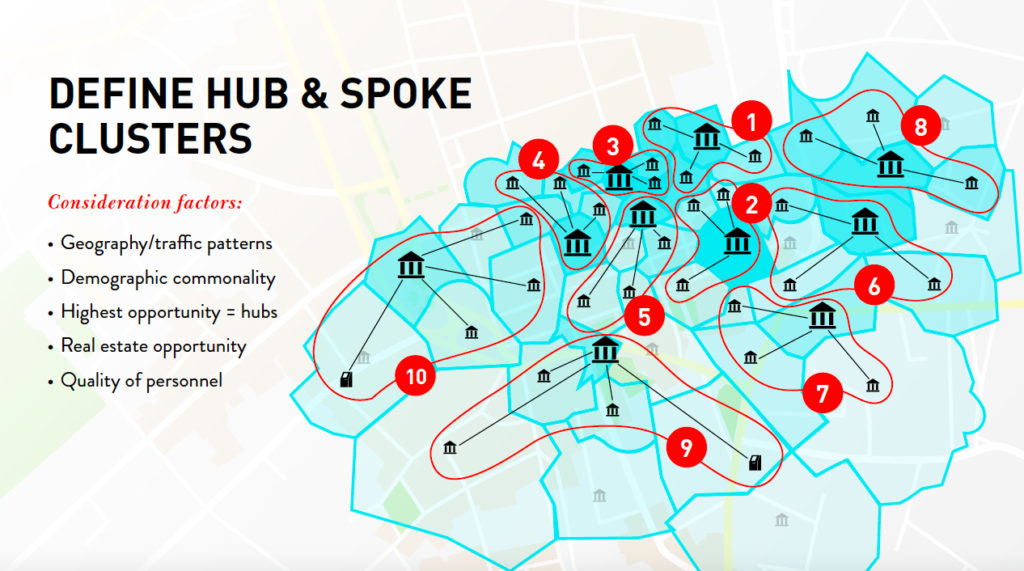
Another efficiency strategy is cluster management. If banks can operate in hub-and-spoke clusters instead of fully autonomous individual branches, they will start to realize reduced staffing costs in the spokes, which enables them to pay for more skilled staff in the hubs. Instead of having middling managers in every individual branch, banks could afford an upgraded super manager in a hub who has oversight over operations in all of the spokes. For example, by upgrading to an $80,000 hub manager, banks can in-turn reduce three $60,000 managers per spoke, resulting in cost savings and more efficiently maximizing market potential in both the hub and the spokes.
Geographics and Demographics
One of the factors for how to cluster within the hub-and-spoke model is geography. Geographic proximity and traffic patterns will help determine how to distribute branches across the network. To maximize the Network Effect, concentrating branches along lines of geographic and demographic commonality will help prime the network for success. For example, if there is a high net worth area and then a low-income adjacent area, banks should consider high net worth branches tied together in a hub-and-spoke with a designated hub – which is in the area of most growth opportunity and real estate availability.
For banks making decisions on hub-and-spoke, they’re balancing opportunity with practicality. For example, a bank may have two branches in a cluster – one of them in a strip mall and the other in a beautiful standalone branch. The strip mall location may have a better opportunity on paper in terms of real estate location, but unless the bank plans on relocating entirely and building a new branch from the ground up, they may choose to stay with the big branch and support it with smaller clusters. Further, the quality of existing personnel is another consideration in hub-and-spoke cluster management. Having to bring in and train new staff adds considerably to costs.
Breaking It Down
Using analytics, banks can tally up the opportunity of end performance of the branches in each cluster and rank them by priority. In this example, clusters with more opportunity have more blue shading around them – so 1 and 2 have the most, then 3, 4, 5, a little less, but still good growth potential, whereas 9 and 10 are candidates for closures because they offer the least growth opportunity. In prioritizing clusters, banks will consider factors impacting their current state, including where the branches are located, how they operate, and ways they are staffed. These branches are then prioritized according to their current state performance compared with their market opportunity.
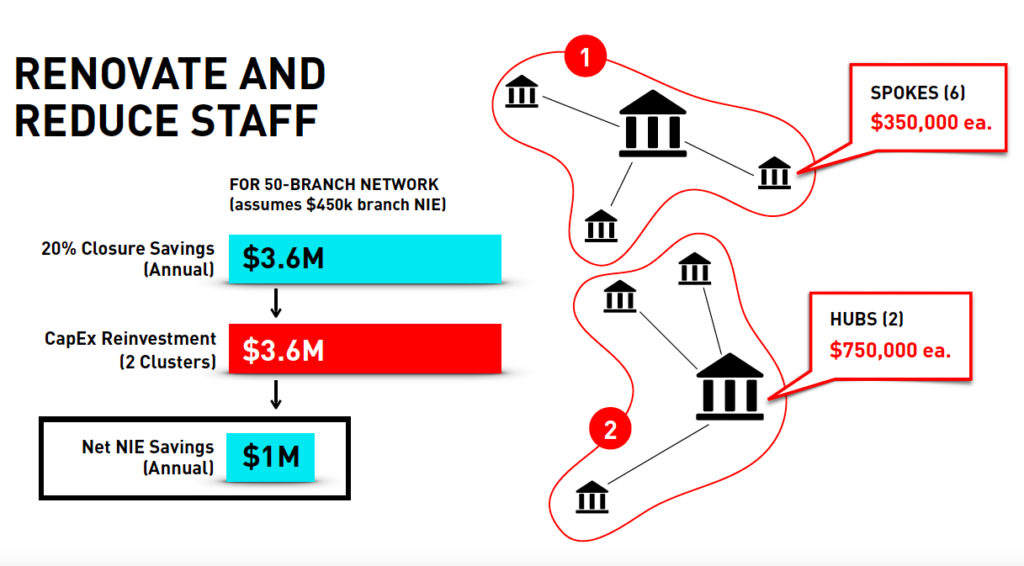
In this example, the average costs about $450,000 of non-interest expense annually to operate. After optimizing the network of 50 branches, the bank realized a savings of $3.6 million annually in non-interest expense. However, it’s not just savings that matter. What banks must do with these savings is reinvest into the remaining network. In this example, closing 20% of branches but reinvesting in the remaining 80% empowered their ongoing growth and expansion. Funding renovations and upgrading staff models were key to hub-and-spoke cluster management that enabled the bank to re-envision their branch network from a cost center to a growth center.
To develop strategies for operating in the post-COVID landscape, contact Adrenaline’s financial experts at info@adrenalinex.com or call (678) 412-6903. For more information on bank branch reopening in the post-COVID landscape, download the Roadmap to Reopening. If you need help preparing your staff for post-COVID branch operations, see the Frontline Staff Engagement Training series.